International Finance for Business Strategy
Question:
Discuss about the International Finance for Business Strategy.
Answer:
Introduction:
The overall study mainly focuses on evaluating the significance of effective strategy for conducting investments in S(USD/AUD). Furthermore, the study also helps in depicting an effective strategy, which could be used for maximising profitability from investment. In addition, the novice effectively conducts continues compound return analysis to evaluate the price movement of USD/AUD from 2003 till date. In addition, the study also evaluates different investment models, which could be used in predicting future price movement and generate a higher return on investment.
a) Drawing continuously compounded returns of S(USD/AUD) graphically and analysing the different distribution:
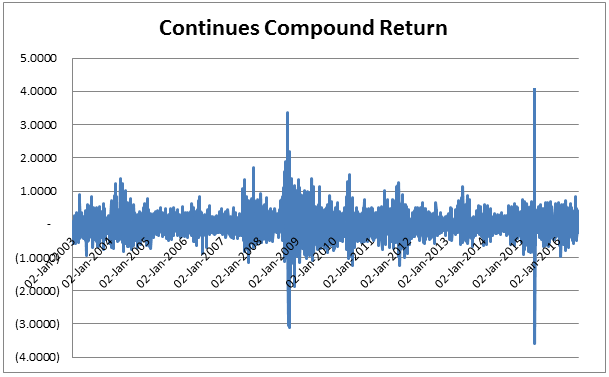
Figure 1: Showing the continues compound return of USD/AUD
(Source: Rba.gov.au 2016)
|
Continues Compound Return |
|
|
Mean |
-0.003691326 |
|
Standard Error |
0.006471632 |
|
Median |
-0.016557167 |
|
Mode |
0 |
|
Standard Deviation |
0.37763513 |
|
Sample Variance |
0.142608291 |
|
Kurtosis |
12.81958866 |
|
Skewness |
0.422382724 |
|
Range |
7.714237387 |
|
Minimum |
-3.600724 |
|
Maximum |
4.113513387 |
|
Sum |
-12.56896616 |
|
Count |
3405 |
Table 1: Depicting the Descriptive analysis of continuous compound return
(Source: Rba.gov.au 2016)
Figure and table 1, mainly depicts the continuous compound return of USD/AUD, which was generated from 2003 till date. Furthermore, the overall graffitical presentation of the figure 1 mainly depicts that it is more or less a non-symmetric bimodal distribution. In addition, theses type of distribution mainly has no prediction, which could help investors increase their return. In this context, Anton and Polk (2014) stated that due to the unsystematic return provided in capital market the overall normal distribution analyses could not be give the required friction to increase investors profitability. On the other hand, McLean and Pontiff (2016) mentioned that some high end investors uses technical analysis and patterns to determine the investment opportunity.
b) Effectively providing evidence for distribution of S(USD/AUD) is different by using 68–95–99.7 normal rule of thumb:
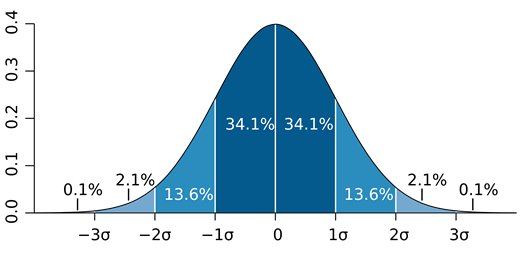
Figure 2: Showing the 68–95–99.7 normal rule of thumb
(Source: Tong 2012)
The overall 68–95–99.7 normal rule of thumb could not be effectively evaluated from figure 2. In addition, with the help of figure 2, the systematic distribution of the data could be effectively analysed. However, Krishnamoorthy et al. (2012) stated that return generated in the currency and capital markets are different from normal distribution. In addition, the diagrammatic view of both figure 2 and 1, could be effectively analysed to depict the irregularity in overall distribution. Furthermore, figure 2 gradually increases and reaches a peak and then gradually decreases from the peak. However, figure 1mainly depicts the return that has been generated from USD/AUD, which in turn has two different peaks. Moreover, a normal distribution could have no more than one peak. Thus, it could be concluded that return from USD/AUD does not have a normal distribution system.
c) Effectively comparing and graphical presenting actual returns with artificially created returns:
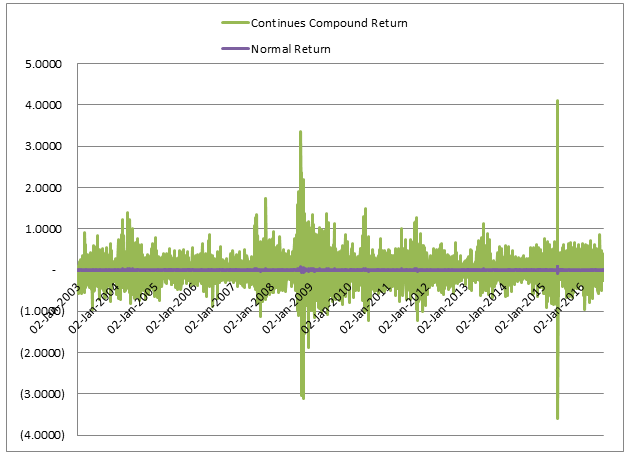
Figure 3: Showing the comparison between Normal and continues compound return
(Source: Rba.gov.au 2016)
Figure 3, mainly provides comparison between normal and continuous compound return generated from USD/AUD. Moreover, from the graph it could be seen that normal return calculation method is mainly used to evaluate the overall return by comparing precious days return. However, the use of Log in return calculation could effectively help in evaluating the cumulative return generated from USD/AUD. This evaluation of cumulative return could effectively help investors to grasp the overall knowledge about return generated from particular investment. In this context, Kogan and Papanikolaou (2013) stated that with the help of effective calculation investors are able to evaluate performance and investment opportunity in a particular security.
Furthermore, the main characteristic that could be gauged upon in different return calculations is its cumulative features. In cumulative return the overall return from a particular security is been analysed. However, normal return calculation only depicts return by comparing previous day’s return. On the other hand, Armstrong and Vashishtha (2012) criticises that evaluation of historical return generation loses its friction during an economic crises, which mainly liquidates the wholes capital market.
d) Evaluating the trend of S(USD/AUD) and making trading strategies based on intuition with valid statistic:
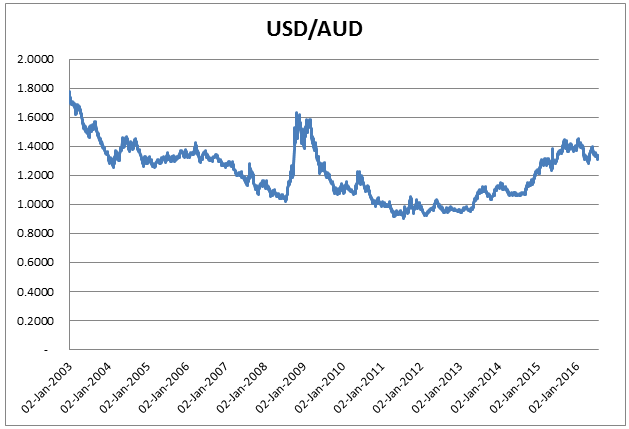
Figure 4: Showing the USD/AUD price movement
(Source: Rba.gov.au 2016)
With the help of figure 4, the overall price movement of USD/AUD from 2003 till data can be effectively evaluated. In addition, on the basis of intuition it could be seen that USD has made a new low in year 2011-2013 and is currently trading under a major resistance level. Furthermore, the recent decline in prices has provided a adequate opportunity for investors to short the market and get appropriate return. Furthermore, with the help of table 1, overall SD of USD/AUD is determined at 0.37763513, which mainly suggested that risk in shoring the current market is relatively low and could provide an adequate return from investment. Tian (2013) mentioned that determining the risk from investment mainly help investors to diversify their investments and generate a higher return. On the other hand, McLean and Pontiff (2016) criticises that without conducting effective research investors are not able to determine the overall risk exposed to a particular investment.
Moreover, with the help of SD and mean derivation, it could be analysed that shorting USD/AUD could help investors increase their profits. In addition, the Mean being negative(-0.003691326) and SD being positive 0.37763513 mainly helps in evaluating the current scenario of the market. Furthermore, investors could increase their profitability by shorting the current currency market. Anton and Polk (2014) argued that statistical representation could lose friction during an economic crisis and depict wrong investment opportunity to investors.
e) Based on an acceptable hypothesis testing procedure taking valid investment or holding decisions for S(USD/AUD) for the next 30 days:
|
Regression Statistics |
|
|
Multiple R |
0.306003148 |
|
R Square |
0.093637926 |
|
Adjusted R Square |
0.061267852 |
|
Standard Error |
0.006665241 |
|
Observations |
30 |
|
ANOVA |
||||||||
|
|
df |
SS |
MS |
F |
Significance F |
|||
|
Regression |
1 |
0.000128511 |
0.000129 |
2.892731 |
0.100062 |
|||
|
Residual |
28 |
0.001243912 |
4.44E-05 |
|||||
|
Total |
29 |
0.001372423 |
|
|
|
|||
|
|
Coefficients |
Standard Error |
t Stat |
P-value |
Lower 95% |
Upper 95% |
Lower 95.0% |
Upper 95.0% |
|
Intercept |
0.749236129 |
0.001222228 |
613.0085 |
2.43E-59 |
0.746733 |
0.75174 |
0.746733 |
0.75174 |
|
Compounding return |
-0.00745343 |
0.004382299 |
-1.7008 |
0.100062 |
-0.01643 |
0.001523 |
-0.01643 |
0.001523 |
Table 2: Depicts the hypothesis of USD/AUD return on investment
(Source: Rba.gov.au 2016)
In addition, the overall table 2 mainly helps in portraying the relevant hypothesis, which could help in generating the required investment opportunity. Furthermore, the overall observation of 30 days mainly predicts positive price movement of USD/AUD. Moreover, positive intercept correlation value mainly depicts that 75% of the price movement is on positive side. Thus, initiating long trades could help the investor to gain short term profits from the currency market. Furthermore, standard error being less than 0.05 mainly indicates that the observations of USD/AUD price movement is correct and could help investors increase return on investment. Tian (2013) argued that statistical assumption could lose friction due to the wrong analysis conducted by investors.
f.1) Evaluating the efficiency of the FX market by analysing Random Walk Model and Autoregressive of order 1 model:
The overall efficiency of the FX market could be effectively evaluated with the help of random walk model and autoregressive model. Furthermore, this method could eventually help investors to predict price movement of securities and attain a return from investment. Moreover, random walk model could be effectively used in portraying the overall prediction on the basis of mean difference in closing prices. This prediction method mainly helps in investors on the basis of closing price fluctuations. However, Evans et al. (2016) argued that models providing stock market prediction on the basis of mean could not effectively depict any investment opportunity created from external factors.
However, Autoregressive of order 1 model effectively uses regression analysis to predict the future price movement and depicts the overall FX price movements. In addition, it effectively uses correlation of both intercept and the first variable to predict the overall price change movement. In this context, Duchon et al. (2012) suggested that investors with the help of adequate prediction are able to evaluate the overall risk of investment in particular securities. On the other hand, Evans et al. (2016) criticises that predicting models are not able to depict an effective sell trading opportunities, which could help in generating short term profitability.
f.2) Computing composite and individual forecast for S(USD/AUD) and evaluating the best model used for forecast:
|
MAE |
MSE |
RMSE |
|||
|
0.0180 |
0.00042 |
0.02039035 |
|||
|
Date |
A |
F |
Error(A-F) |
Abs |
SQ error |
|
15-Jul-2016 |
1.3113 |
1.3134 |
(0.0021) |
0.0021 |
0.00000 |
|
18-Jul-2016 |
1.3158 |
1.3129 |
0.0029 |
0.0029 |
0.00001 |
|
19-Jul-2016 |
1.3282 |
1.3124 |
0.0158 |
0.0158 |
0.00025 |
|
20-Jul-2016 |
1.3332 |
1.3119 |
0.0212 |
0.0212 |
0.00045 |
|
21-Jul-2016 |
1.3356 |
1.3114 |
0.0242 |
0.0242 |
0.00059 |
|
22-Jul-2016 |
1.3376 |
1.3110 |
0.0267 |
0.0267 |
0.00071 |
|
25-Jul-2016 |
1.3360 |
1.3105 |
0.0255 |
0.0255 |
0.00065 |
|
26-Jul-2016 |
1.3293 |
1.3100 |
0.0193 |
0.0193 |
0.00037 |
|
27-Jul-2016 |
1.3365 |
1.3095 |
0.0270 |
0.0270 |
0.00073 |
|
28-Jul-2016 |
1.3289 |
1.3090 |
0.0199 |
0.0199 |
0.00040 |
Table 3: Showing the Forecast using Random Walk Model
(Source: Rba.gov.au 2016)
|
MAE |
MSE |
RMSE |
|||
|
(0.0258) |
0.00070 |
0.026483887 |
|||
|
Date |
A |
F |
Error(A-F) |
Abs |
SQ error |
|
15-Jul-2016 |
1.31130 |
1.34089 |
(0.0296) |
0.0296 |
0.00088 |
|
18-Jul-2016 |
1.31579 |
1.33825 |
(0.0225) |
0.0225 |
0.00050 |
|
19-Jul-2016 |
1.32820 |
1.34283 |
(0.0146) |
0.0146 |
0.00021 |
|
20-Jul-2016 |
1.33316 |
1.35550 |
(0.0223) |
0.0223 |
0.00050 |
|
21-Jul-2016 |
1.33565 |
1.36056 |
(0.0249) |
0.0249 |
0.00062 |
|
22-Jul-2016 |
1.33761 |
1.36310 |
(0.0255) |
0.0255 |
0.00065 |
|
25-Jul-2016 |
1.33601 |
1.36510 |
(0.0291) |
0.0291 |
0.00085 |
|
26-Jul-2016 |
1.32926 |
1.36346 |
(0.0342) |
0.0342 |
0.00117 |
|
27-Jul-2016 |
1.33654 |
1.35658 |
(0.0200) |
0.0200 |
0.00040 |
|
28-Jul-2016 |
1.32890 |
1.36401 |
(0.0351) |
0.0351 |
0.00123 |
Table 4: Showing the Forecast using Autoregressive of order 1 model
(Source: Rba.gov.au 2016)
With the help of table 2 and 3, the overall significance of adequate trend prediction model could be effectively evaluated. In addition, random walk model has a lower RMSE and MSE, while its MAD is positive. Thus, it could be concluded that random walk model is more effective than Autoregressive of order 1 model (Kokoszka and Reimherr 2013).
g) Performing risk assessment and evaluating the risk implications for investments on a daily basis:
Risk assessment analysis on the basis of parametric method
|
Parameters |
|
|
Portfolio Value |
1,000,000 |
|
Average Return |
(0.016235337) |
|
Standard Deviation |
0.000176083 |
|
Confidence Level |
0.99 |
|
Calculations |
|
|
Min Return with 99% probability |
(0.016644969) |
|
Value of Portfolio |
983,355.0312 |
|
Value at Risk |
16,644.96879 |
Table 5: Showing the calculation for risk analysis of parametric method
(Source: Rba.gov.au 2016)
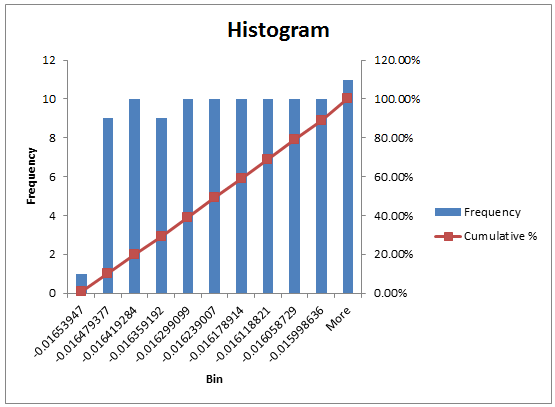
Figure 5: Showing risk analysis of Historical method
(Source: Rba.gov.au 2016)
With the help of parametric and historical simulation method the overall risk of investment for 100 days can be effectively evaluated. However, table 5 depicts that there is risk in investment, which might affect investors return from USD/ AUD.
Conclusion:
The overall assignment mainly depicts the models and strategies that could be used by the investors to increase their return from currency trade. Furthermore, the assignment also helps in evaluating the overall risk assessment and return valuation generated from USD/USD. Moreover, the novice effectively signifies the use of appropriate forecasting model, which could be used in maximising profitability. In addition, the study also evaluates the market return with normal distribution to find relative answers. Furthermore, the novice uses hypothesis and risk evaluation to analyse the overall investment risk, which could be faced by investors.
Reference:
Anton, M. and Polk, C., 2014. Connected stocks. The Journal of Finance,69(3), pp.1099-1127.
Armstrong, C.S. and Vashishtha, R., 2012. Executive stock options, differential risk-taking incentives, and firm value. Journal of Financial Economics, 104(1), pp.70-88.
Dambreville, R., Blanc, P., Chanussot, J. and Boldo, D., 2014. Very short term forecasting of the Global Horizontal Irradiance using a spatio-temporal autoregressive model. Renewable Energy, 72, pp.291-300.
Duchon, J., Robert, R. and Vargas, V., 2012. Forecasting volatility with the multifractal random walk model. Mathematical Finance, 22(1), pp.83-108.
Evans, D.R., Kwak, H.S., Giesen, D.J., Goldberg, A., Halls, M.D. and Oh-e, M., 2016. Estimation of charge carrier mobility in amorphous organic materials using percolation corrected random-walk model. Organic Electronics, 29, pp.50-56.
Kogan, L. and Papanikolaou, D., 2013. Firm characteristics and stock returns: The role of investment-specific shocks. Review of Financial Studies,26(11), pp.2718-2759.
Kokoszka, P. and Reimherr, M., 2013. Determining the order of the functional autoregressive model. Journal of Time Series Analysis, 34(1), pp.116-129.
Krishnamoorthy, K., Mathew, T. and Mukherjee, S., 2012. Normal-based methods for a gamma distribution. Technometrics.
McLean, R.D. and Pontiff, J., 2016. Does academic research destroy stock return predictability?. The Journal of Finance, 71(1), pp.5-32.
Rba.gov.au, (2016). Available from: http://www.rba.gov.au/statistics/historical-data.html#exchange-rates [Accessed on 23 Jul. 2016].
Tian, W., 2013. A review of sensitivity analysis methods in building energy analysis. Renewable and Sustainable Energy Reviews, 20, pp.411-419.
Tong, Y.L., 2012. The multivariate normal distribution. Springer Science & Business Media.
ussot, J. and Boldo, D., 2014. Very short term forecasting of the Global Horizontal Irradiance using a spatio-temporal autoregressive model. Renewable Energy, 72, pp.291-300.
Duchon, J., Robert, R. and Vargas, V., 2012. Forecasting volatility with the multifractal random walk model. Mathematical Finance, 22(1), pp.83-108.
Evans, D.R., Kwak, H.S., Giesen, D.J., Goldberg, A., Halls, M.D. and Oh-e, M., 2016. Estimation of charge carrier mobility in amorphous organic materials using percolation corrected random-walk model. Organic Electronics, 29, pp.50-56.
Kogan, L. and Papanikolaou, D., 2013. Firm characteristics and stock returns: The role of investment-specific shocks. Review of Financial Studies,26(11), pp.2718-2759.
Kokoszka, P. and Reimherr, M., 2013. Determining the order of the functional autoregressive model. Journal of Time Series Analysis, 34(1), pp.116-129.
Krishnamoorthy, K., Mathew, T. and Mukherjee, S., 2012. Normal-based methods for a gamma distribution. Technometrics.
McLean, R.D. and Pontiff, J., 2016. Does academic research destroy stock return predictability?. The Journal of Finance, 71(1), pp.5-32.
Rba.gov.au, (2016). Available from: http://www.rba.gov.au/statistics/historical-data.html#exchange-rates [Accessed on 23 Jul. 2016].
Tian, W., 2013. A review of sensitivity analysis methods in building energy analysis. Renewable and Sustainable Energy Reviews, 20, pp.411-419.
Tong, Y.L., 2012. The multivariate normal distribution. Springer Science & Business Media.


